Use Procmon for Defender AV Performance Issues
- Anand P
- Nov 17, 2021
- 3 min read
Updated: Jul 8, 2022
Hi All, in this blog I will be explaining how to collect Procmon logs for defender AV performance issue
I usually get requests from different users especially developers that their machine is slow and not able to work post enabling Defender AV and it's affecting the performance of the machine.
Yes, this is expected because AV has to check files that are being used and if there are any changes to the file, scan it, there are many other factors for AV scan which I will be explaining in my upcoming blogs.
Step 1: Download Procmon from the Link or you can download it from Sysinternals Link as well. once downloaded I copied the file to a temp folder which will be easy for me to do cleanup later, and unzip the file in the same folder


Before you ‘unzip’ ProcessMonitor.zip, right-click on “ProcessMonitor.zip”
And next to “This file came from another computer and might be blocked to help protect this computer”.
Check the box to "Unblock"

Once extracted you can see the below files in one folder

Eula.txt – The license agreement you’ll have to accept before running the procmon. procmon.chm – The help file contains all of the provided documentation. Procmon.exe – The main EXE that will launch the correct procmon instance (x86 or x64). Procmon64.exe – The x64 procmon binary. Procmon64a.exe – The alpha 64 procmon binary.
Step 2: Now you can either start Procmon by right-clicking on the Procmon.exe file and clicking run as administrator or by using the Command line

By default, the capture begins immediately when procmon starts, first, the logging/capture needs to be stopped, use the keyboard shortcut CTRL+E for that click the icon on top marked in the below screenshot
when the icon is highlighted as blue it's capturing

When the icon is not highlighted the capturing is stopped

You need to clean the existing capture by clicking on the delete icon or by keyboard shortcut CTRL+X

You can start procmon using the command line, use the below command to start before that make sure you are in the path where procmon is extracted in my case I have extracted in temp, in the command prompt navigate to the folder, in my case it is
cd c:\temp\ProcessMonitor 
Once you are in the directory run the below command to start Procmon
Procmon.exe /AcceptEula /Noconnect /Profiling Once you start procmon you need to add a filter for the Defender AV process (MsMpEng.exe), this will filter only the process related to Defender AV, and click on Add and apply.

To ADD a filter select the Filter option from the Menu tab and select Filter, this will take you to the above option

Procmon will start capturing the utilization of the MsMpEng.exe process

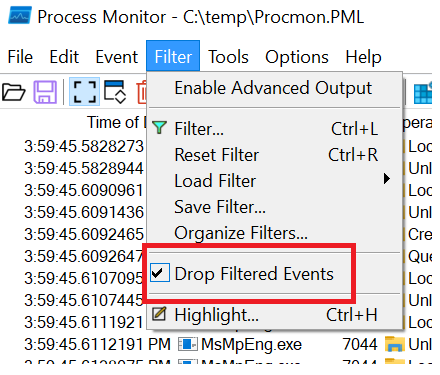
Note: if you are running procmon for a long make sure you have enabled Drop Filtered Events, this will drop other events and only collect the selected one.

Try to reproduce the issue which will help to collect the right data once completed you can save the file as a PML file
Step 3: Once procmon is collected stop the capture as explained previously and save the file Navigate to File select Save or use Ctrl+S to save.

Select Events displayed using the current filter and format as PML, you can provide a relevant name for the capture, usually, I prefer to provide the computer name and data along with that to identify easily.

For better tracking, change the default path
from C:\temp\ProcessMonitor\LogFile.PML to C:\temp\ProcessMonitor\%ComputerName%_LogFile_MMDDYEAR.PML where:
%ComputerName% is the device name
MMDDYYYY is the month, day, and year
If you like to learn more about procmon there is a wonderful blog written by Adam Bertram please refer to the Link (https://adamtheautomator.com/procmon/)
Reference


Comments